This bull market has baffled.
Source: Bloomberg
It's been one year since equity markets bottomed, beginning an epic rally that confounded and caught so many by surprise. Some of the commentary questioning why the rebound even happened amid a worsening pandemic is perplexing, revealing a lack of understanding of secular bull markets and the concept of momentum even among the most astute market observers.
The problem is that much of the explanations rely on clichés (a 20% drop designates a bear market), assumptions (you can spot a bubble in real time) and market myths (why is the time the earth takes to orbit the sun relevant to stocks?) that often lead investors astray. A few observations are helpful in better understanding the move over the past 12 months, and what may lie ahead.
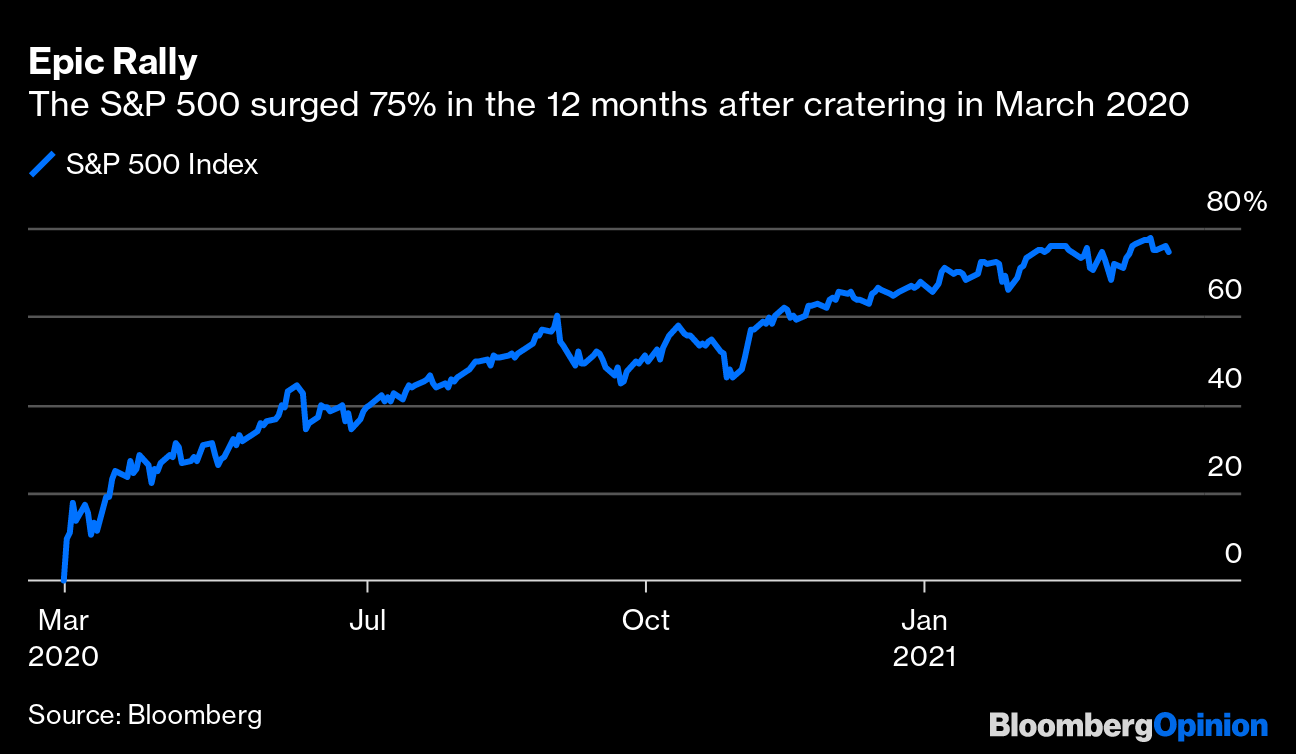
• Context Matters: The S&P 500 Index posted its best 12-month performance in history between March 23, 2020, and March 23, 2021, gaining 74.8%. This looks impressive and suggests something important, but it lacks the proper context to fully understand what took place. Get beyond your denominator blindness and note the larger picture.
Instead of looking at a 12-month chart that starts at the lows, go back 13 months. The S&P 500 is up 15.5% over that period. That’s a nice return, but not very unusual. Context matters.
Epic Rally
The S&P 500 surged 75% in the 12 months after cratering in March 2020
Source: Bloomberg
From Wow to Meh
Equities are up a more modest 15% over the past 13 months
Source: Bloomberg
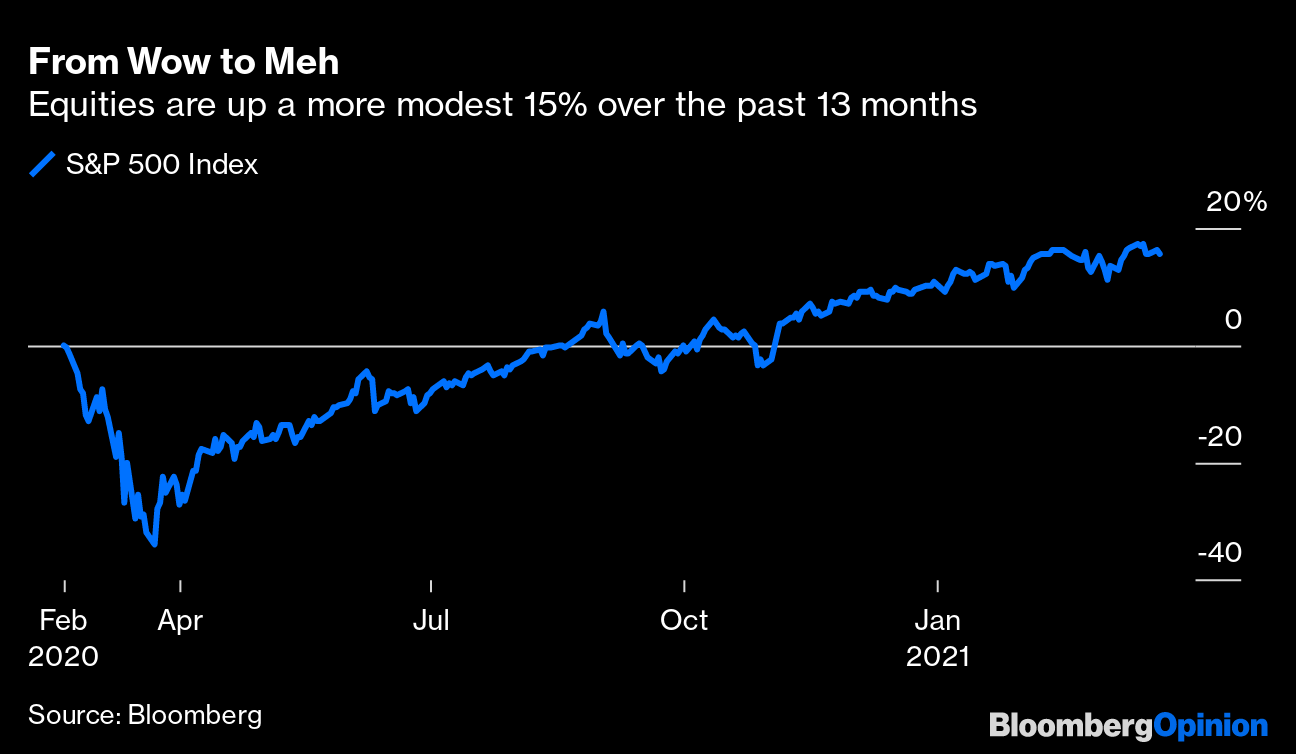
Also worth noting: When the price of an asset falls 34%, it requires about a 52% move higher to get back to breakeven.
• Momentum: Investors and traders are attracted to stocks with rising prices. They may not understand what might be driving prices higher, but many don’t need or even want an explanation. Whatever the reason, traders recognize that price is a more reliable tell than the surrounding narratives; gains beget gains and price increases beget more price increases. This is perhaps why momentum is one of many Fama-French factors contributing to alpha, or the extra return an investment generates above a certain benchmark.
• Externalities: There are numerous reasons to put the pandemic in the same category as other non-economic events that had an impact on financial markets, such as the Sept. 11, 2001, terrorist attacks, Pearl Harbor bombing, or the John F. Kennedy assassination. Just as the 1982 to 2000 bull market was not ended by the 1987 crash, I don't believe the 2020 pandemic ended the bull market that began in 2013. As I wrote last April:
“The average investor should be working from a long-term plan that won’t blow up because of a short-term disruption caused by issues like the coronavirus pandemic. Remain disciplined and stick with your goals. Seems easy to do, except sometimes it isn’t when the alarm bells are going off.”
As it turned out, the pre-collapse peak on Feb. 19, 2020, was reclaimed by August 2020. The fastest 30% drop in history followed by such a rapid recovery was an indicator that the bull market was far from over. This is not hindsight bias, but what we were discussing in real time as the market bottomed.
• Rotating Buyers/Sellers: We tend to discuss buyers and sellers as if they are monolithic blocks, but that is not the case. Holders of stocks are different depending on what point we’re at in the market cycle. My strictly anecdotal observation of participants as we made those February highs, plummeted to the March lows and then recovered to make new highs goes something like this:
Last year began as the prior one ended, with markets adding to the 29% gains of 2019. Momentum traders were enjoying the rally, and as the market reached its peak, index fund companies such as Vanguard, Blackrock and State Street, as well as 401(k) investors and dollar-cost-averagers kept doing their thing. These price insensitive investors are always buyers, both on the way up and on the way down. As the market rolled over, panicked selling became noticeable. Some of it came from hedge funds, all too aware of monthly performance targets closely watched by their investors. There was likely some nervous retail sellers as well.
Normally, a bear market takes months or years to fully develop. This one ran to its nadir in just 34 days, so the timeline was a bit compressed. Once the market fell 20% or so, the “buy the dip crowd” hardly had time jump in before the dip became a crash. At 25% off the top, the contrarians began to put their toes in the water. So too did those who “rebalance” their portfolios to maintain a steady allocation to equities. This group acts as volatility dampeners in both directions, rebalancing into peaks and valleys. So-called structural money — think sovereign wealth funds, endowments and foundations — were also buyers on the way down. They have perpetual time horizons that allows them to embrace risk in ways short-term traders can’t.
Once prices fell 30%, the value investors got excited. As prices rose, and a new uptrend was established, the trend followers re-joined the party. By mid-August, the market broke out to new highs, attracting those who employ technical analysts to guide their investing.
• Is this the second year of a new bull market? Would you say 1989 was the second year of a new bull market following the October 1987 crash? Few were saying that at the time. Instead, we learned the crash was an anomaly caused by numerous factors, especially the excessive reliance on “portfolio insurance” and creaky, outdated financial “plumbing” in use at the New York Stock Exchange.
Regardless, the forces underlying the secular bull market that began in 1982 powered ahead, making 1987 more of a digestion of the gains in the prior five years than an end to the bull market. (How many remember that the S&P 500 actually eked out a gain of 2.03% in 1987, overcoming that 20.5% drop on Oct. 19?) Rallies and declines that run counter to prior market moves do not mark the end of longer-term secular trends.
Bull markets do not begin from the lowest depths of bear markets. The 1982 -2000 bull market did not start in 1974 any more than the current bull began in March 2009. Just as there are high-water marks in hedge funds so too there are high-water marks in bear markets. A new bull market does not begin until it makes new highs; in the present case that would be March 2013.
If ever you needed proof that the day-to-day noise is a boon for traders but the bane of investors, 2020 was it. Had you missed the entire year, and not ever touched your portfolios, you would have been much better off. That might be a lesson for the next market spasm that comes your way.
This column does not necessarily reflect the opinion of the editorial board or Bloomberg LP and its owners.
To contact the editor responsible for this story:
Robert Burgess at bburgess@bloomberg.net
"many" - Google News
March 28, 2021 at 07:00PM
https://ift.tt/2P6eSAJ
Wall Street: The Many Misconceptions About the Bull Market - Bloomberg
"many" - Google News
https://ift.tt/2OYUfnl
https://ift.tt/3f9EULr
No comments:
Post a Comment